3 Biomakers in pharmaceutical settings
The following definition of Biomarkers are defined by FDA[1].
Diagnositic biomaker
A biomarker used to detect or confirm presence of a disease or condition of interest or to identify individuals with a subtype of the disease.
Monitor biomaker
A biomarker measured repeatedly for assessing status of a disease or medical condition or for evidence of exposure to (or effect of) a medical product or an environmental agent.
Response Biomarker
A biomarker used to show that a biological response, potentially beneficial or harmful, has occurred in an individual who has been exposed to a medical product or an environmental agent.
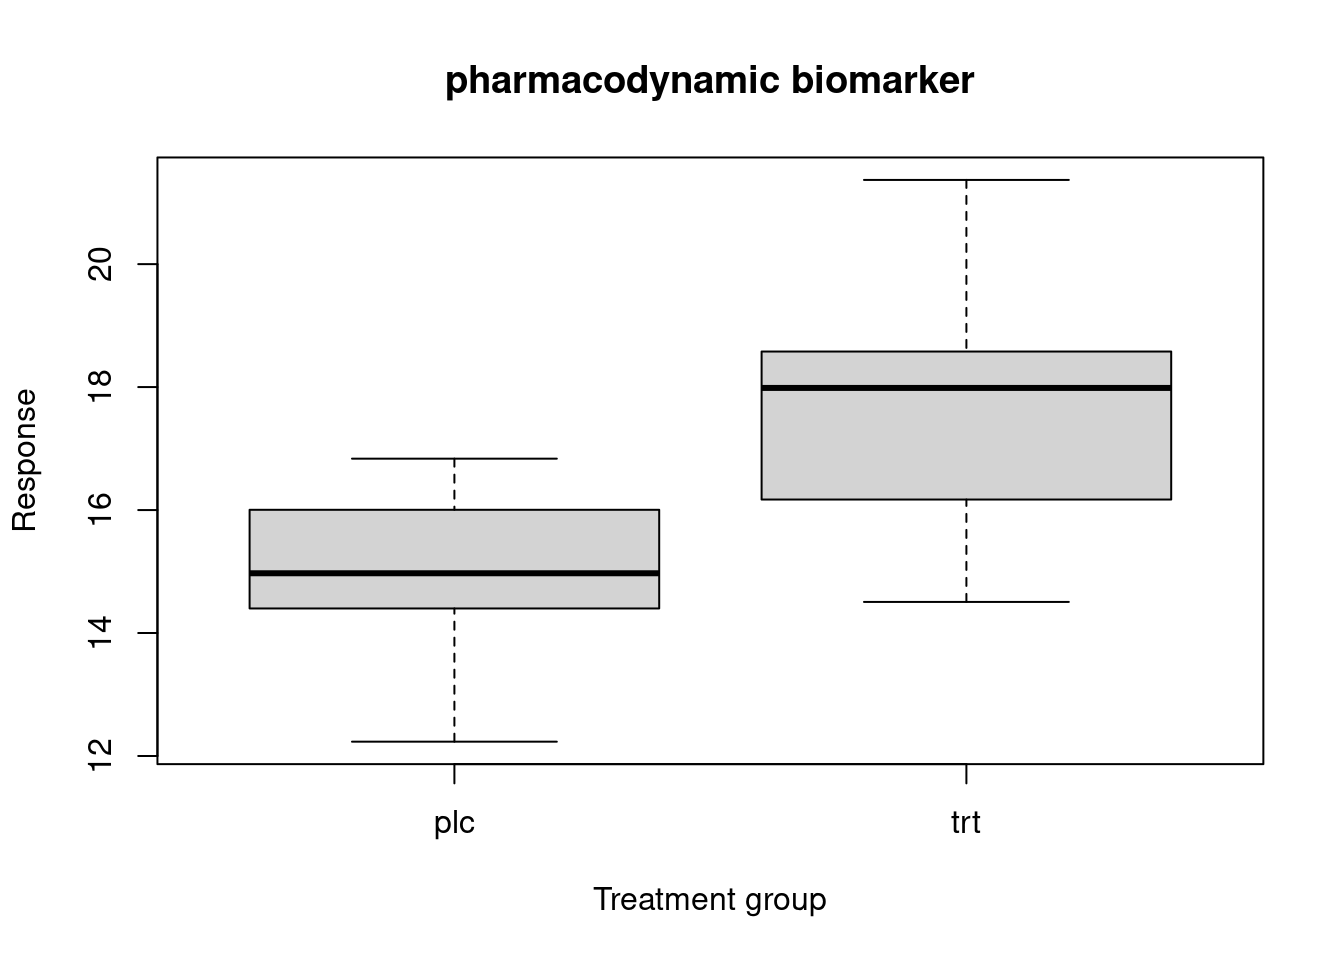
Pharmacodynamic biomarker
A response biomarker that indicates biologic activity of a medical product or environmental agent without necessarily drawing conclusions about efficacy or disease outcome or necessarily linking this activity to an established mechanism of action. Potential uses of a pharmacodynamic biomarker include establishing proof-of-concept, assisting in dose selection or measuring a response to medical products or environmental agents, including the use as a measure of potential harm. In some cases, such measures may be secondary endpoints in clinical trials and may be described in labeling.
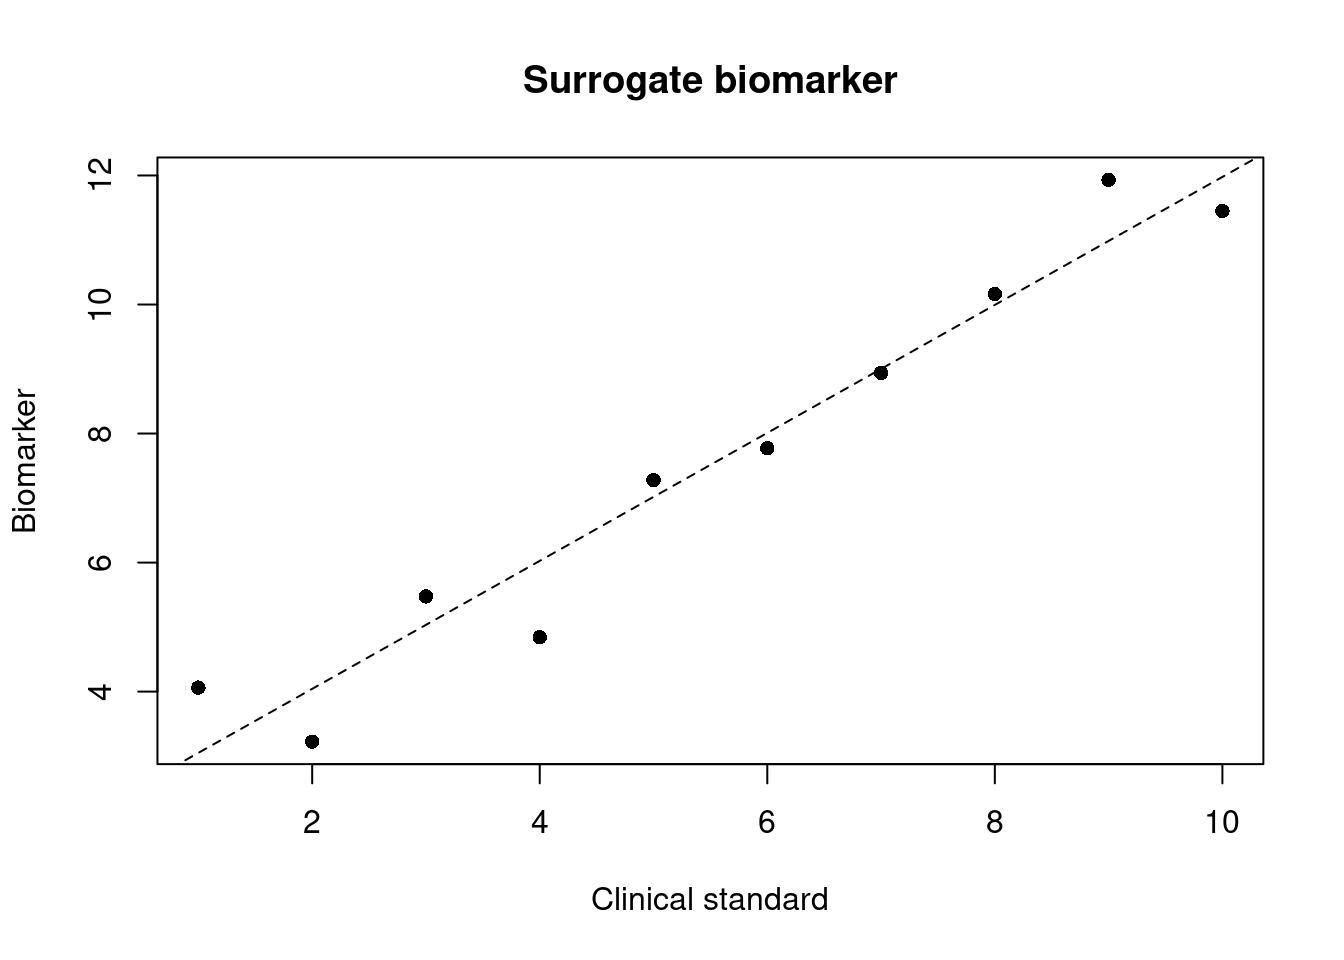
Surrogate endpoint biomarker
A response biomarker that is an endpoint used in clinical trials as a substitute for a direct measure of how a patient feels, functions, or survives. A surrogate endpoint does not measure the clinical benefit of primary interest in and of itself, but rather is expected to predict that clinical benefit or harm based on epidemiologic, therapeutic, pathophysiologic, or other scientificscientificscientificevidence.
From a U.S. regulatory standpoint, surrogate endpoints and potential surrogate endpoints can be characterized by the level of clinical validation:
- validated surrogate endpoint
- reasonably likely surrogate endpoint
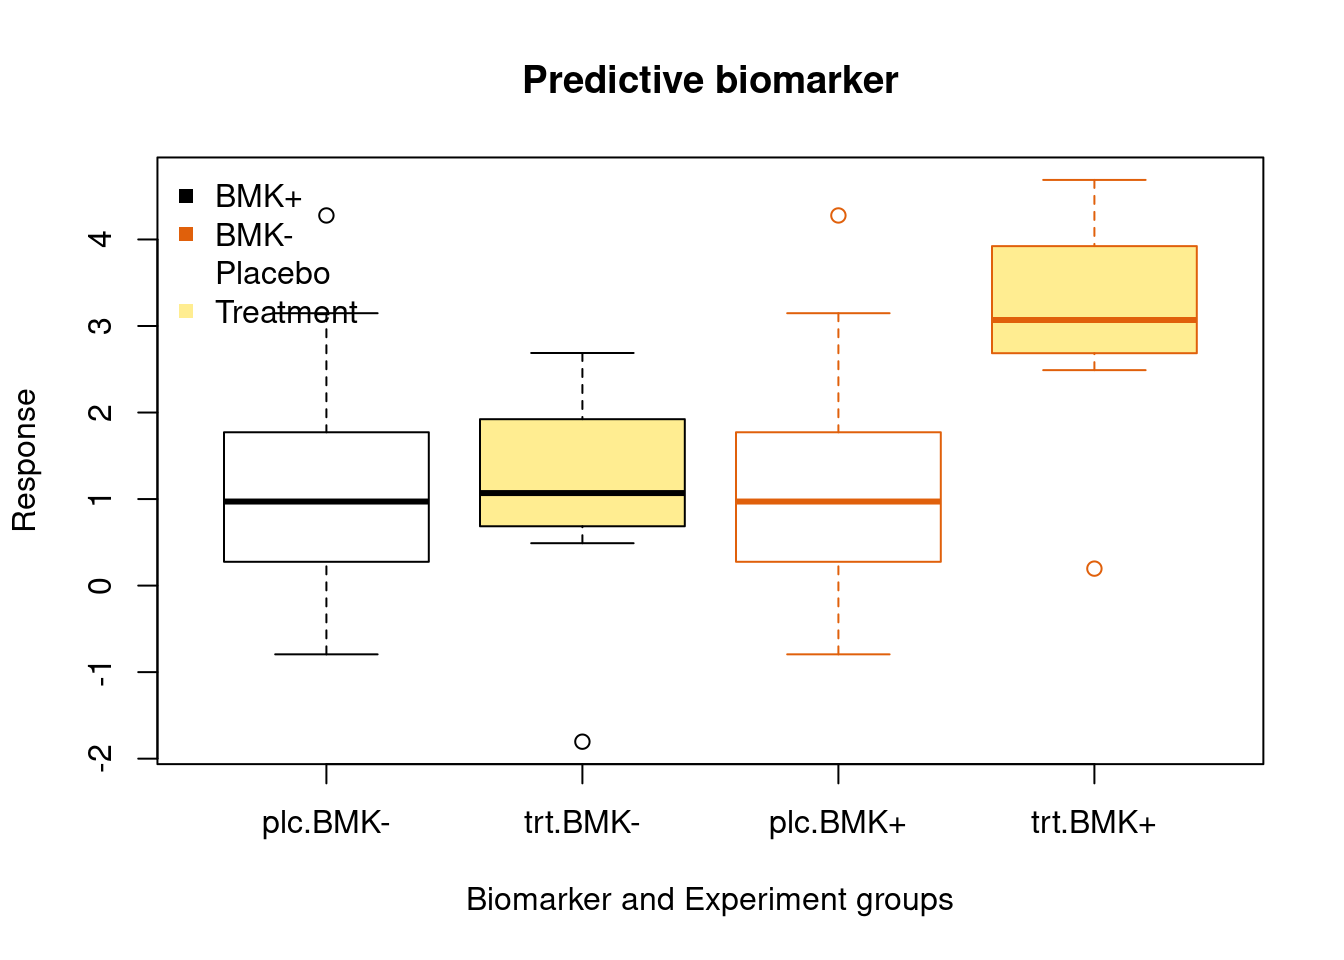
Predictive biomaker
A biomarker used to identify individuals who are more likely than similar individuals without the biomarker to experience a favorable or unfavorable effect from exposure to a medical product or an environmental agent.
 Prognostic Biomarker
A biomarker used to identify likelihood of a clinical event, disease recurrence or progression in patients who have the disease or medical condition of interest.
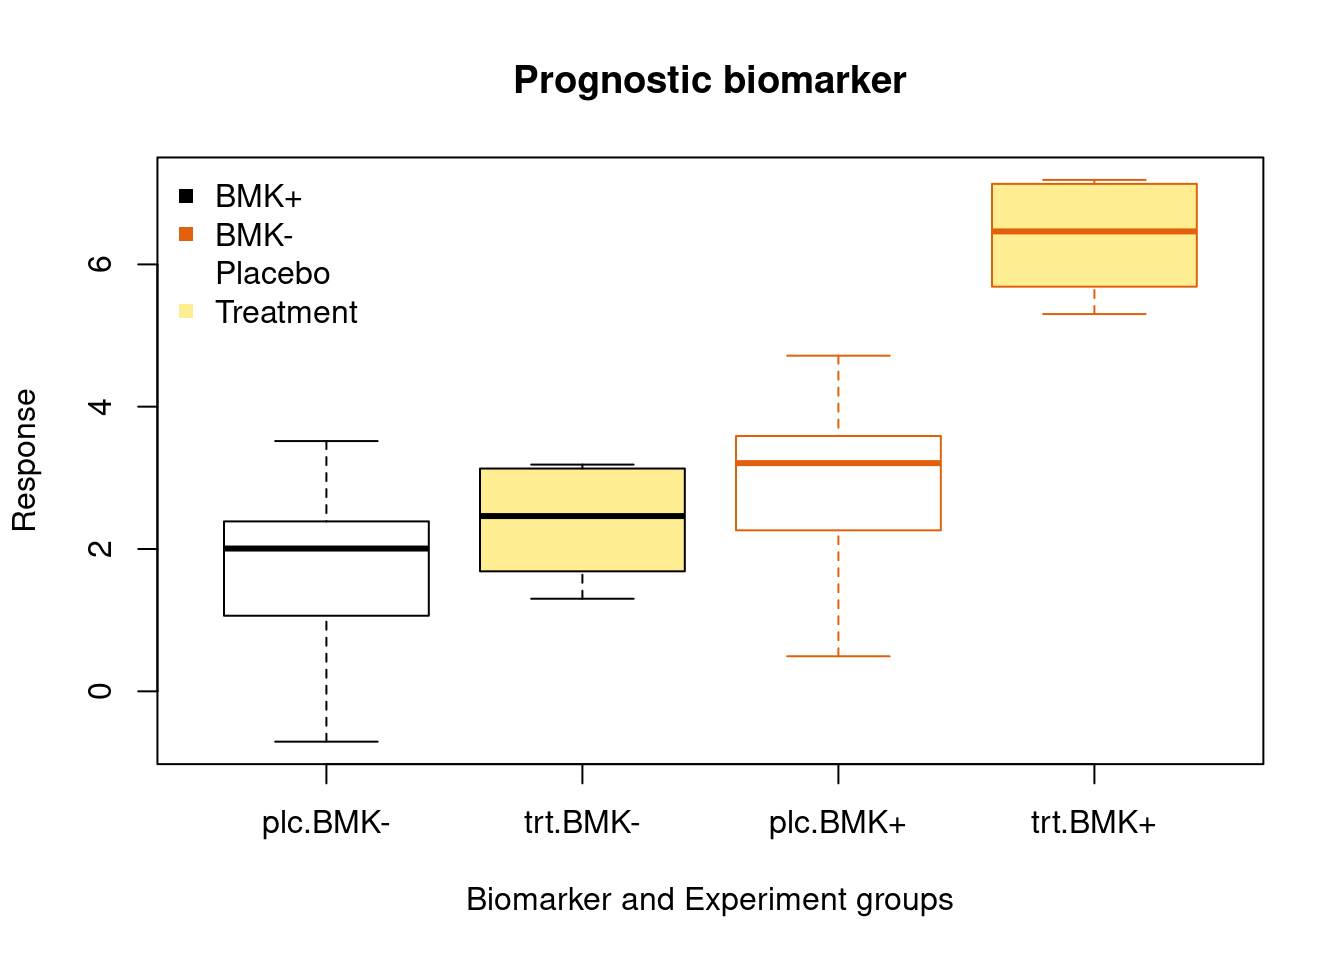
Illustration of the difference between progonostic and predictive biomarker
| Treatment | BMK + | BMK- |
|---|---|---|
| standard | a | b |
| experiment | c | d |
According toFDA-NIH Biomarker Working Group, BEST (Biomarkers, EndpointS, and other Tools) Resource


Example of a biomarker that is prognostic but not predictive. Assume that patients have been randomized to the experimental and standard therapies. A) For patients receiving the experimental therapy, those who are positive for the biomarker (black curve) survive longer than those who are negative for the biomarker (gray curve). B) The biomarker is associated with the same difference in survival for those patients receiving the standard therapy (black dashed curve versus gray dashed curve); therefore, it is prognostic. The biomarker is not predictive for benefit of the experimental therapy (solid curves) relative to the standard therapy (dashed curves) because within each biomarker subgroup the survival distribution is the same regardless of treatment received. source:https://www.ncbi.nlm.nih.gov/books/NBK402284/figure/prognostic_predictive.F1/?report=objectonly

Example of a predictive biomarker that exhibits a quantitative treatment-by-biomarker statistical interaction. Assume that patients have been randomized to the experimental and standard therapies. Within each biomarker subgroup (black curves for biomarker positive and gray curves for biomarker negative), survival is substantially longer for patients who receive the experimental therapy (solid curves) compared to standard therapy (dashed curves). The magnitude of the increase in survival for those receiving experimental therapy compared to standard therapy is numerically larger for those who are positive for the biomarker than for those who are negative for the biomarker.

Example of a predictive biomarker that exhibits a qualitative treatment-by-biomarker statistical interaction. Assume that patients have been randomized to the experimental and standard therapies. For patients who are positive for the biomarker (black curves), survival is substantially longer for patients who receive the experimental therapy (solid black curve) compared to standard therapy (dashed black curve); whereas, for patients who are negative for the biomarker (gray curves), survival is about the same or slightly shorter for patients who receive the experimental therapy (solid gray curve) compared to standard therapy (dashed gray curve).